Intro
Overview
This class is about two things: iteratively drawing pictures with quantitative data, building models with the data, and drawing pictures of both the models and the data. Our goal is to master contemporary software that will enable you to explore data to generate hypotheses, and convey features and relationships to others.
Data Scientist (n.): Person who is better at statistics than any software engineer and better at software engineering than any statistician. —Josh Wills
One of the fundamental texts (Wilkinson) was written in conjunction with a pretty dated technology (SYSTAT), later acquired by SPSS (itself eventually acquired by IBM), and if that’s your language of choice, by all means try and do the assignments in it (I suspect this will be hard to do well). It is fair to say that the reference implementation of Wilkinson’s ideas is Hadley Wickham’s R version, called ggplot2. Another paradigm is the functional one of Trellis/Lattice, and Deepayan Sarkar’s R implementation is standard. If you are an accomplished Pythonista and adept in Matplotlib (and probably Pandas), by all means do your assignments in Python. Finally, on the cutting edge, many things are moving toward the browser, and D3.js (Data-Driven Documents) is the lingua franca. Making your graphs with it will probably be the most challenging, but if you choose to study it in depth, I would expect that it will be the most rewarding in terms of the tricks and techniques you develop in this class. Assignments will use primarily R and D3.
Objectives
- Learn enough to be dangerous about the modern high- and low-level languages and libraries
- Master the everyday, mundane but indispensible tools of the trade: text editors, version control, and the command line
- Practice iterative and collaborative (yes, even Agile) development of your projects
- Initiate and participate in code and project reviews
- Fail early, learn from it, and ask for help
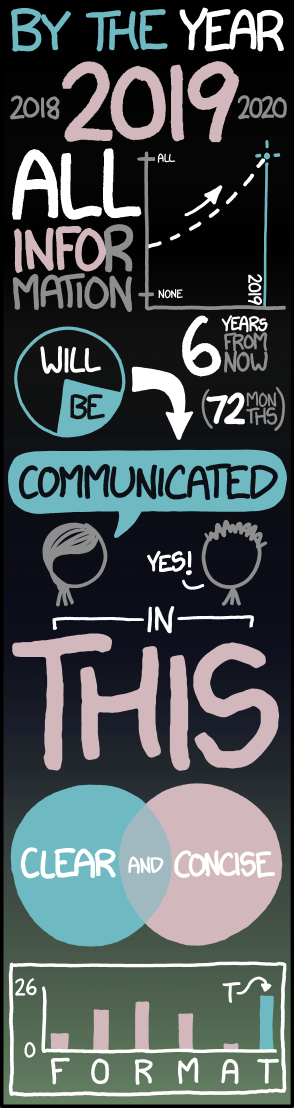
We are here to do what we can to prevent this grim future:
Goals
- Think like a data scientist about data visualization
- Code like a data scientist
Think like a data scientist
This means approaching data, especially graphs, with an especially critical eye, informed by theory, and being able to say things like:
- This is misleading
- This would be clearer if
- This overencodes data
- Why can’t I hover over this and see that
Code like a data scientist
Coming up with constructive criticism is one thing. Implementing your ideas is another.
Requirements
Four coding/graphing assignments (40%)
Students will complete four assignments and submit them to this course repository as pull requests. Instructions will be given on file naming / location / linking conventions. The assignments themselves will be fairly narrowly focussed on specific tools and coding and graphing tasks.
Two Quizzes (20%)
Quizzes are essential for assessing student learning and pedagogical efficacy. There will be 4 quizzes in total; students may pick their best two to count towards their grade.
A project in your area of specialization using statistical graphics (30%)
Final project should be done as group of 2-3. The project includes collecting data, cleaning data, conducting data analysis, prototyping visualization, implementing visualization, demonstrating the implementation in a presentation to the entire class / online.
The course is roughly divided into four three-week sprints toward a final project release. Planning means listing tasks, defining scope, dividing work, and continual reassessment and adjustment.
- Iteration/sprint plans, progress assessments
- The actual project including a presentation (similar in form to another blog post), explaining code / tools / libraries you learned doing the project
Participation in class — (10%)
- Attendance
- Debugging
- Peer code review