R_miniassigment_dvl2110_calendar_heatmap
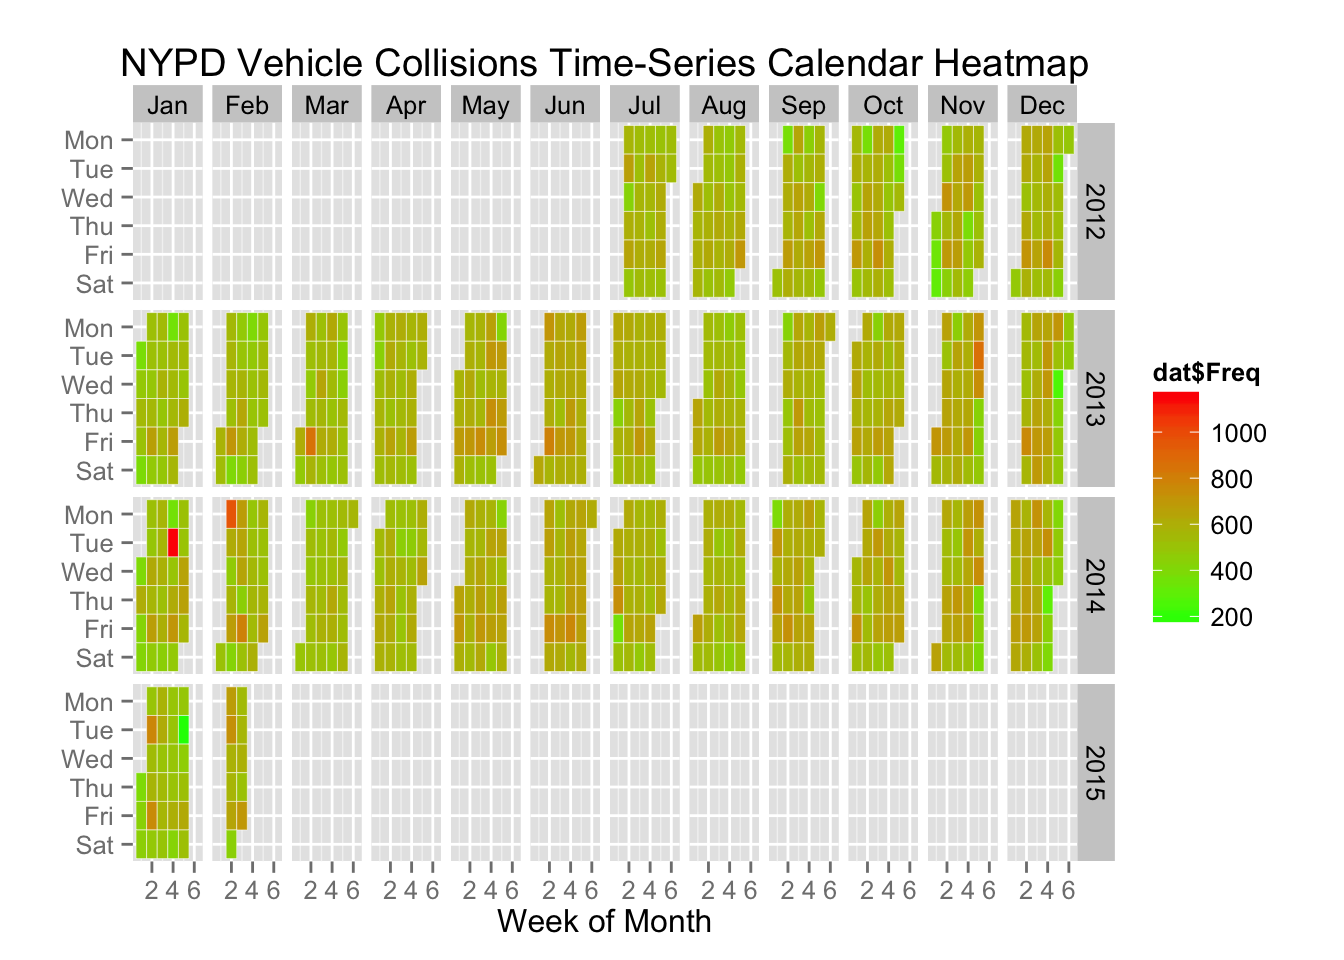
NYPD Motor Vehicle Collisions Calendar Heatmap
Data source: http://dev.socrata.com/foundry/#/data.cityofnewyork.us/h9gi-nx95
#load libraries
library(data.table)
library(ggplot2)
library(GGally)
require(quantmod)
require(reshape2)
require(plyr)
require(scales)

#set directory
setwd(dir='/Users/dennis/Dropbox/Columbia STAT MA Spring 2015/4701 DATA VIZ/Homeworks/NYPD/')

#load data
#' Data source: http://dev.socrata.com/foundry/#/data.cityofnewyork.us/h9gi-nx95
data <- fread('NYPD_Motor_Vehicle_Collisions.csv')


#' ### Analysing dates of event

# We will facet by year ~ month, and each subgraph will
# show week-of-month versus weekday
# the year is simple

dat <- {}
dates <- as.Date(data$DATE,format = "%m/%d/%Y")
dates <- na.omit(dates)
dat <- as.data.frame(table(dates))
names(dat) <- c('date','Freq')
dat$date <- as.Date(dat$date)

# We will facet by year ~ month, and each subgraph will
# show week-of-month versus weekday
# the year is simple

dat$year<-as.numeric(as.POSIXlt(dat$date)$year+1900)
# the month too
dat$month<-as.numeric(as.POSIXlt(dat$date)$mon+1)
# but turn months into ordered facors to control the appearance/ordering in the presentation
dat$monthf<-factor(dat$month,levels=as.character(1:12),labels=c("Jan","Feb","Mar","Apr","May","Jun","Jul","Aug","Sep","Oct","Nov","Dec"),ordered=TRUE)
# the day of week is again easily found
dat$weekday = as.POSIXlt(dat$date)$wday
# again turn into factors to control appearance/abbreviation and ordering
# I use the reverse function rev here to order the week top down in the graph
# you can cut it out to reverse week order
dat$weekdayf<-factor(dat$weekday,levels=rev(1:7),labels=rev(c("Mon","Tue","Wed","Thu","Fri","Sat","Sun")),ordered=TRUE)
# the monthweek part is a bit trickier
# first a factor which cuts the data into month chunks
dat$yearmonth<-as.yearmon(dat$date)
dat$yearmonthf<-factor(dat$yearmonth)
# then find the "week of year" for each day
dat$week <- as.numeric(format(dat$date,"%W"))

# and now for each monthblock we normalize the week to start at 1
dat<-ddply(dat,.(yearmonthf),transform,monthweek=1+week-min(week))
dat <- na.omit(dat)

# Now for the plot
P<- ggplot(dat, aes(monthweek, weekdayf, fill = dat$Freq)) +
    geom_tile(colour = "white") + facet_grid(year~monthf) + scale_fill_gradient(low="green", high="red") +
    labs(title = "NYPD Vehicle Collisions Time-Series Calendar Heatmap") +  xlab("Week of Month") + ylab(" ")
P